
Key Takeaways
- This year has already proven uncommon for both the market and the election cycle.
- Cocoa has been the standout commodity this year, with contracts more than doubling, reaching a level twice as high as the previous record.
- The Fed continues to indicate potential cuts, though Chairman Jerome Powell has stated they are in no hurry.
After the “everything rally” of 2023, many investors entered the year with high hopes for financial markets, the economy, and possible rate cuts. This optimism was well-founded as equity markets, particularly in the United States, have surged.
The S&P 500, Dow Jones Industrial Average, and NASDAQ all reached record highs at the end of the quarter. Initially technology-centric on Wall Street, this rally has now spread to Europe and Japan, with equities in these regions catching up to the United States.
By the end of March, indices from the United Kingdom, Germany, France, and Spain surpassed the S&P 500, indicating a broad-based market recovery beyond the technology sector.
Resilience of U.S. Treasury Yields
Despite initial expectations, the yield on the benchmark 10-year U.S. Treasury has shown resilience, rising from 3.860% at the beginning of the year to 4.20% at the end of the quarter.
Investors had initially anticipated six rate cuts from the Federal Reserve in 2024, reducing the benchmark rate to around 3.75% or 4%. However, strong inflation figures for January and February and robust economic growth prompted investors to adjust their expectations.
The Fed continues to indicate potential cuts, though Chairman Jerome Powell has stated they are in no hurry. This alignment of investor expectations with the Fed’s projections has led to an uptick in Treasury yields.
Commodities Experience a Surge
Gold reached a record high at $2,264 toward the end of the quarter, propelled by purchases from central banks diversifying their reserves and persistent retail demand from Chinese investors.
The conflict in the Middle East has significantly impacted oil markets, pushing the price of crude oil over $85 after trading in the $70s in December and January.
Cocoa has been the standout commodity this year, with contracts more than doubling to reach a level in March twice as high as the previous record.
This surge is driven by climate change's effects on small farmers in West Africa, who grow most of the cash crop, and the complexities of the future market, where a short squeeze could be accelerating upward price pressures.
What’s Been Driving Markets?
The Economy, Inflation, & the Fed
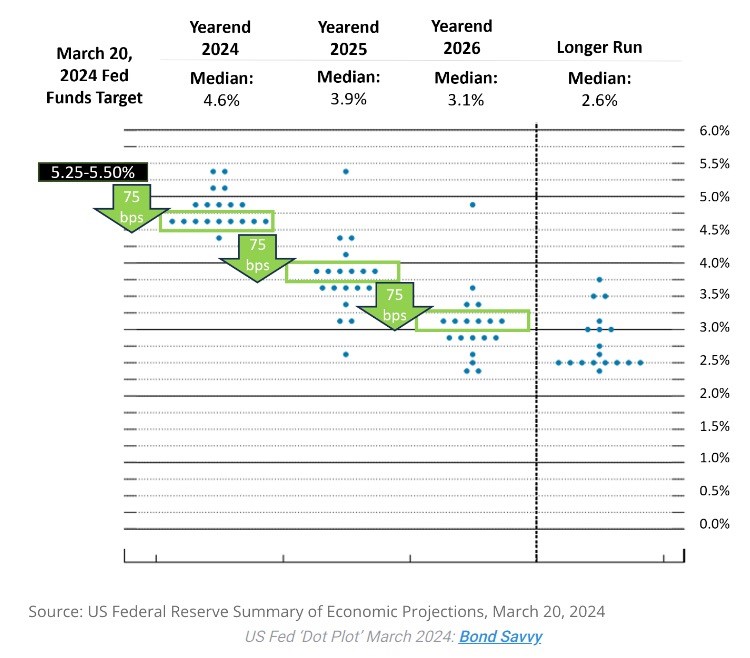
Persistent inflation in the United States and Europe is compelling investors to rethink their optimistic outlook for the global economy. This comes amid concerns that the lingering inflation could mirror the “stagflation” of the 1970s. Based on the economic data over January and February, the Fed has opted to keep the Fed Funds Rate unchanged at 5.25% to 5.50%.
In a tentative move, Fed officials have planned for 0.75% rate cuts by the end of the year without commitment to a specific timeframe.
The Fed’s latest projections, as shown in the “Dot Plot” below, indicate approximately 0.75% rate cuts in the next three years — 2024, 2025, and 2026. Yet, Federal Reserve Chairman Powell recently shared that the central bank is in no hurry to cut rates.
The “Magnificent 7” Ride No More
The “Magnificent 7” tech stocks that contributed significantly to the market’s impressive gains in 2023 have exhibited mixed performance over the first quarter. While the group has accounted for 37% of the S&P 500’s YTD return, not all are still hitting it out of the park.
Nvidia continues to shine with a year-to-date increase of 82.28%. Meta Platforms and Amazon have also delivered solid performances, rising by 37.19% and 18.56%, respectively, while Microsoft has grown by 11.88%. Meanwhile, Alphabet, the owner of Google, has been relatively average at 7.98%.
However, some “Magnificent 7” members are faltering amidst this glowing performance. Apple has dipped by 10.93%. Moreover, Tesla experienced a significant drop of 29.25%, making it the worst-performing stock in the S&P 500 as the broader EV market decelerates.
How Investors Should React
This year has already proven uncommon for both the market and the election cycle. Traditionally, election years positively impact the stock market, with most gains appearing in the second half of the year.
The S&P 500 is already up over 10% YTD, closely resembling the average for full-year returns. The tech sector, usually the poorest performer during elections, is leading in 2024.
The last two election periods have seen some market volatility, and with the contentious nature of the 2024 elections, investor anxiety is expected.
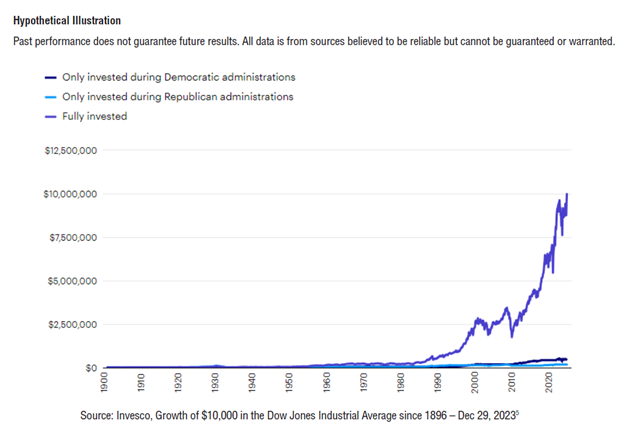
We may see further volatility before and after the election. Still, historically and irrespective of political outcomes, investors who can look past the immediacy of the moment and stay focused on the long term are well-positioned for success.
As the chart below demonstrates, staying fully invested has been the best course of action regardless of political outcome.
Financial Advisor offers Investment Advisory Services though Eide Bailly Advisors LLC, a Registered Investment Advisor. Eide Bailly Advisors, LLC. is owned by Eide Bailly LLP. Eide Bailly Advisors, LLC and Symmetry Partners, LLC are not affiliated companies.
Eide Bailly Advisors, LLC and Symmetry Partners, LLC charge investment advisory fees for their services. All Eide Bailly and Symmetry Partners’ fees information can be found in the ADV Part 2A located on the Eide Bailly website www.eidebaillywealth.com and Symmetry Partners’ website www.symmetrypartners.com.
The firm only transacts business in states where it is properly registered, or excluded or exempt from registration requirements. Registration with the SEC or any state securities authority does not imply a certain level of skill or training. Different types of investments involve varying degrees of risk, and there can be no assurance that the future performance of any specific investment, investment strategy, product or any non- investment related content made reference to directly or indirectly in this commentary will be profitable, equal any corresponding indicated historical performance level(s), be suitable for your portfolio or individual situation, or prove successful. Due to various factors, including changing market conditions and/or applicable laws, the content may not be reflective of current opinions or positions. Please note the material is provided for educational and background use only. Moreover, you should not assume that any discussion or information contained in this material serves as the receipt of, or as a substitute for, personalized investment advice. Diversification seeks to improve performance by spreading your investment dollars into various asset classes to add balance to your portfolio. Using this methodology, however, does not guarantee a profit or protection from loss in a declining market. Past performance does not guarantee future results.
Index Disclosure and Definitions All indexes have certain limitations. Investors cannot invest directly in an index. Indexes have no fees. Historical performance results for investment indexes generally do not reflect the deduction of transaction and/or custodial charges or the deduction of an investment management fee, the incurrence of which would have the effect of decreasing historical performance. Actual performance for client accounts may differ materially from the index portfolios.
S&P 500 Index represents the 500 leading U.S. companies, approximately 80% of the total U.S. market capitalization. Dow Jones Industrial Average (DJIA) Is a price-weighted average of 30 significant stocks traded on the New York Stock Exchange (NYSE) and the NASDAQ. The Nasdaq Composite Index (NASDAQ) measures all Nasdaq domestic and international based common type stocks listed on The Nasdaq Stock Market, and includes over 2,500 companies. MSCI World Ex USA GR USD Index captures large and mid cap representation across 22 of 23 developed markets countries, excluding the US. The index covers approximately 85% of the free float-adjusted market capitalization in each country. MSCI Emerging Markets Index is a free float-adjusted market capitalization index that is designed to measure equity market performance in the global emerging markets (as defined by MSCI). The index consists of the 25 emerging market country indexes. Bloomberg Barclays US Aggregate Bond Index measures the performance of the U.S. investment grade bond market. The index invests in a wide spectrum of public, investment-grade, taxable, fixed income securities in the United States – including government, corporate, and international dollar-denominated bonds, as well as mortgage-backed and asset-backed securities, all with maturities of more than 1 year. Bloomberg Barclays Global Aggregate (USD Hedged) Index is a flagship measure of global investment grade debt from twenty-four local currency markets. This multi-currency benchmark includes treasury, government-related, corporate and securitized fixed-rate bonds from both developed and emerging market issuers. Index is USD hedged.
© Morningstar 2024. All rights reserved. The information contained herein: (1) is proprietary to Morningstar and/or its content providers; (2) may not be copied, adapted or distributed; and (3) is not warranted to be accurate, complete or timely. Neither Morningstar nor its content providers are responsible for any damages or losses arising from any use of this information, except where such damages or losses cannot be limited or excluded by law in your jurisdiction. Past financial performance is no guarantee of future results.
The Power of Diversification in Your Investment Strategy

Investment Solutions
Eide Bailly can help you create a customized investment strategy.